Slide Hub is an internal Databricks app. Field engineers use it to find and reuse slides from about 700 internal presentations: event talks, product decks, and architecture decks. A search bar finds single slides by meaning and by keyword, and a Model Context Protocol (MCP) server gives AI agents the same search. The app stores its slides, votes, search telemetry, and change history in Lakebase Postgres. We use Slide Hub as the baseline to benchmark Lakebase Postgres. It is a real app with a real use case and real users, so its numbers show how the database behaves under an actual workload.
This post is for developers and architects who build apps on Databricks and want search inside the app's own Lakebase Postgres database. It assumes that you know SQL and the basics of PostgreSQL. If you plan a search bar or an agent tool on Lakebase Postgres, the numbers below help you choose the compute size before you go to production.
This post shows how Slide Hub runs search inside Lakebase Postgres, what limits it under load, what it costs, and how Lakebase Search behaves from 1M to 4M rows of a public corpus.
One database for the app and its search
Lakebase Search became generally available in September. It is a set of Postgres extensions, so it runs next to the application tables. The app does not copy data to a separate search system. The developer does not maintain a second transaction path.
Two CREATE EXTENSION statements enable the components. lakebase_vector stores embeddings, vectors of numbers that represent the meaning of a text, and supports the lakebase_ann index for approximate nearest neighbor (ANN) search. lakebase_text supports the lakebase_bm25 index for BM25, a standard method that ranks text by the query words it contains. lakebase_tokenizer is optional. The ANN index uses IVF partitioning, which groups similar vectors so a query reads only a few groups, and RaBitQ quantization, which compresses each vector to about 1 bit per dimension. BM25 scores text with the <@> operator.
Slide Hub’s 23k slide rows sit in the same serverless Lakebase Postgres instance as the votes, telemetry, change history, previews, and both indexes. The app reads the data and the indexes inside one connection and one permission model.
The search query
Slide Hub runs hybrid search. It combines vector search, which finds slides with a similar meaning to the query, and BM25 keyword search, which finds slides that contain the query words. Each method returns a short list of its best matches, the candidates. One SQL statement carries the whole ranking policy. It ranks each candidate list, fuses the two rankings, applies the app filters, and joins the votes. Search and app logic share one connection, one set of grants, and one commit.
Slide Hub takes 200 candidates from each method. It fuses the two lists with Reciprocal Rank Fusion (RRF) at k=60: a slide scores 1/(60 + its rank) in each list, and the two scores add. A similarity gate of 0.70 rejects vector matches that are too far from the query to be useful for this embedding model. Title tiers add weight when the query matches a slide title. Notes receive weight 0.5. Scope filters restrict the result to assets the user has permission to see.
What limits the app under load
A search request uses two separate computes, and either one can set the limit.
Lakebase Postgres compute runs the database. Lakebase Postgres sizes it in Compute Units (CU). One CU allocates about 2 GB of RAM to the database, with its share of CPU and local SSD. A compute autoscales between a minimum and a maximum size from 0.5 CU to 64 CU, and the maximum can be at most 16 CU above the minimum. Fixed-size computes go up to 112 CU, and computes up to 32 CU can scale to zero.Postgres stores tables and indexes in 8 KB pages. Lakebase Postgres keeps recently read pages in a Local File Cache (LFC) on the compute. The cache grows with the CU size and can use up to 75% of the compute's memory. A page that is not in the cache comes from storage, which takes longer.
Databricks Apps compute runs the Slide Hub web server. Its size is fixed per app. A MEDIUM app has up to 2 vCPU and 6 GB of memory, and a LARGE app has up to 4 vCPU and 12 GB. Slide Hub runs one app instance. Each Python worker process in it holds a pool of 8 database connections, so 2 workers open at most 16 connections and 4 workers open at most 32.
For each request, the app embeds the query text, sends one SQL statement to Lakebase Postgrse, and returns the result. To find the limit, the test changes one side at a time. It pins Lakebase Postgres at one CU size and changes the app, or it keeps the app and changes the CU size. A load generator simulates users that send search requests, and it raises the number of users in steps. The list shows requests per second and the median latency (p50) at 500 users for each Lakebase Postgres size and app size.
- 1 CU, MEDIUM app with 2 workers: 196 req/s, p50 1.8 s
- 0.5 to 1 CU, LARGE app with 4 workers: 193 req/s, p50 1.6 s
- 2 CU, MEDIUM app with 2 workers: 201 req/s, p50 1.8 s
- 4 CU, MEDIUM app with 2 workers: 219 req/s, p50 1.6 s
- 8 CU, MEDIUM app with 2 workers: 336 req/s, p50 1.0 s
- 16 CU, MEDIUM app with 2 workers: 349 req/s, p50 1.0 s
- 16 CU, LARGE app with 4 workers: at least 662 req/s, p50 343 ms
Up to 4 CU, Lakebase is the limit. A LARGE app with twice the workers and connections adds nothing at 1 CU. At 1 CU the search statement averaged 146 ms and read 14.9M pages from storage, with a file cache of 1.5 GB. At 8 CU it averaged 34 ms, with a cache of 12 GB, and throughput rose about 50%.
From 8 CU, the app is the limit. 16 CU with the same MEDIUM app adds only 4%, and its database connections sit mostly idle. A LARGE app with 4 workers at 16 CU reaches at least 662 req/s, and there the load generator was the limit. Size the query first. Then scale Lakebase Postgres until the app workers are the limit, and then scale the app.
Takeaway: Find the limit before you scale. Below 8 CU, add Lakebase Postgres CU. From 8 CU, give the app more workers.
The connection pool is still necessary. At 50 users the app reached 45 req/s and 2.4 s p95 without the pool, and 85 req/s and 0.7 s p95 with it. The embedding cache made no measurable difference under load.
Candidate pools and cold starts
The candidate limit sets the number of pages a query touches. On a cold cache, that number sets the latency. Slide Hub shipped with 1,000 candidates per method. The docs pattern uses 40. The candidate-limit experiment changed only candidate_limit and measured 20 public queries in three states. Cold is the first query after the compute scaled to zero, with an empty cache. First-touch is the first run of a query on an awake compute. Repeat is the same query run again, with its pages in the cache. Pages touched counts the pages a query reads from any source. Top-10 overlap is the share of the top 10 results that match the result at 1,000 candidates.
- 40 candidates: cold 127 ms, first-touch 13 ms, repeat 5.0 ms. Touches 5,655 pages. Top-10 overlap 74.5%.
- 100 candidates: cold 240 ms, first-touch 16 ms, repeat 7.9 ms. Touches 7,355 pages. Top-10 overlap 89%.
- 200 candidates: cold 387 ms, first-touch 24 ms, repeat 11.7 ms. Touches 10,401 pages. Top-10 overlap 90.5%.
- 1,000 candidates: cold 740 ms, first-touch 109 ms, repeat 35.3 ms. Touches 28,972 pages. Top-10 overlap 100% (the reference).
At 200 candidates, 90.5% of the top 10 stays the same, and the reported number of matches is 81% of the number at 1,000 candidates. Users rarely page past 200 results, so Slide Hub now ships 200. Measured end to end from a job in the same cloud region as the app, a cold search at 200 candidates took 2.9 s, and a repeat search took 40 ms. The cold time has two parts. The connection waits about 1 s while the endpoint wakes up. Then each query reads its pages from storage until the cache warms. The first query on a new connection also pays about 75 ms of planning.
Takeaway: Keep the candidate pool small. 200 candidates keep 90.5% of the top 10 results, read about a third of the pages of 1,000 candidates, and halve the cold latency.
Scale: 1M to 4M rows of MIRACL English
The scale tests use MIRACL English, a passage corpus built from Wikipedia. The full corpus has 32,893,221 passages. We embedded it with gte-large-en-v1.5, a 1024-dimension open model, the same size as the Slide Hub embeddings. We self-hosted the model on one A10G GPU at 379 passages per second. The whole corpus took 2.95 GPU-hours, against $48.87 for the same work on a model-serving endpoint. The GPU vectors matched the endpoint vectors (mean cosine 1.0000, minimum 0.9978).
We built three subsets: 1M, 2M, and 4M passages. The lakebase_ann index grew with the corpus: 5.8 GB at 1M, 11.5 GB at 2M, 23.0 GB at 4M. A binary COPY loaded all 4M rows in 19 minutes at 8 CU.
Lakebase Postgres holds about 1.6 GB of file cache per CU. Scale raises one question: what happens when the index is larger than the cache? Each test cell is one corpus size at one CU size, so the cache is a known fraction of the index. We call that fraction the cache ratio: cache size divided by vector index size. A ratio of 1.0 means the index just fits. The hit rate is the share of the pages a query reads that do not come from storage.
We ran three query mixes against each cell. The uniform mix sends a new title every time and never repeats, the worst case for a cache. The skewed mix draws from a pool of 20,000 titles with a Zipf distribution, a common model for search traffic. The cold mix runs the first queries right after a wake-up, when the cache is empty. Before the uniform and skewed measurements, a warm-up runs the same mix until the hit rate stops changing. We call the results after the warm-up warm.
Hit rate follows the cache ratio

Hit rate over cache ratio. The 2M and 4M curves overlap, so the ratio is the sizing axis.
The hit rate depends on the cache ratio. The corpus size does not change it: the 2M and 4M points fall on one curve. At a ratio of 0.07 the skewed mix hit 45% of its pages in cache. At 0.57 it hit 86%. At 1.14, where the index just fits, it hit 97%. The uniform mix sits a few points lower, because it reuses nothing.
That gives a sizing rule. Measure your index size, pick a CU size for the cache ratio you want, and read the hit rate off the curve. The ratio works across corpus sizes, so a test at 2M predicts the behavior at 4M.
Takeaway: Size the cache from the vector index, not from the row count. A cache about as large as the index serves 95% to 98% of the pages without storage.
Latency follows the hit rate
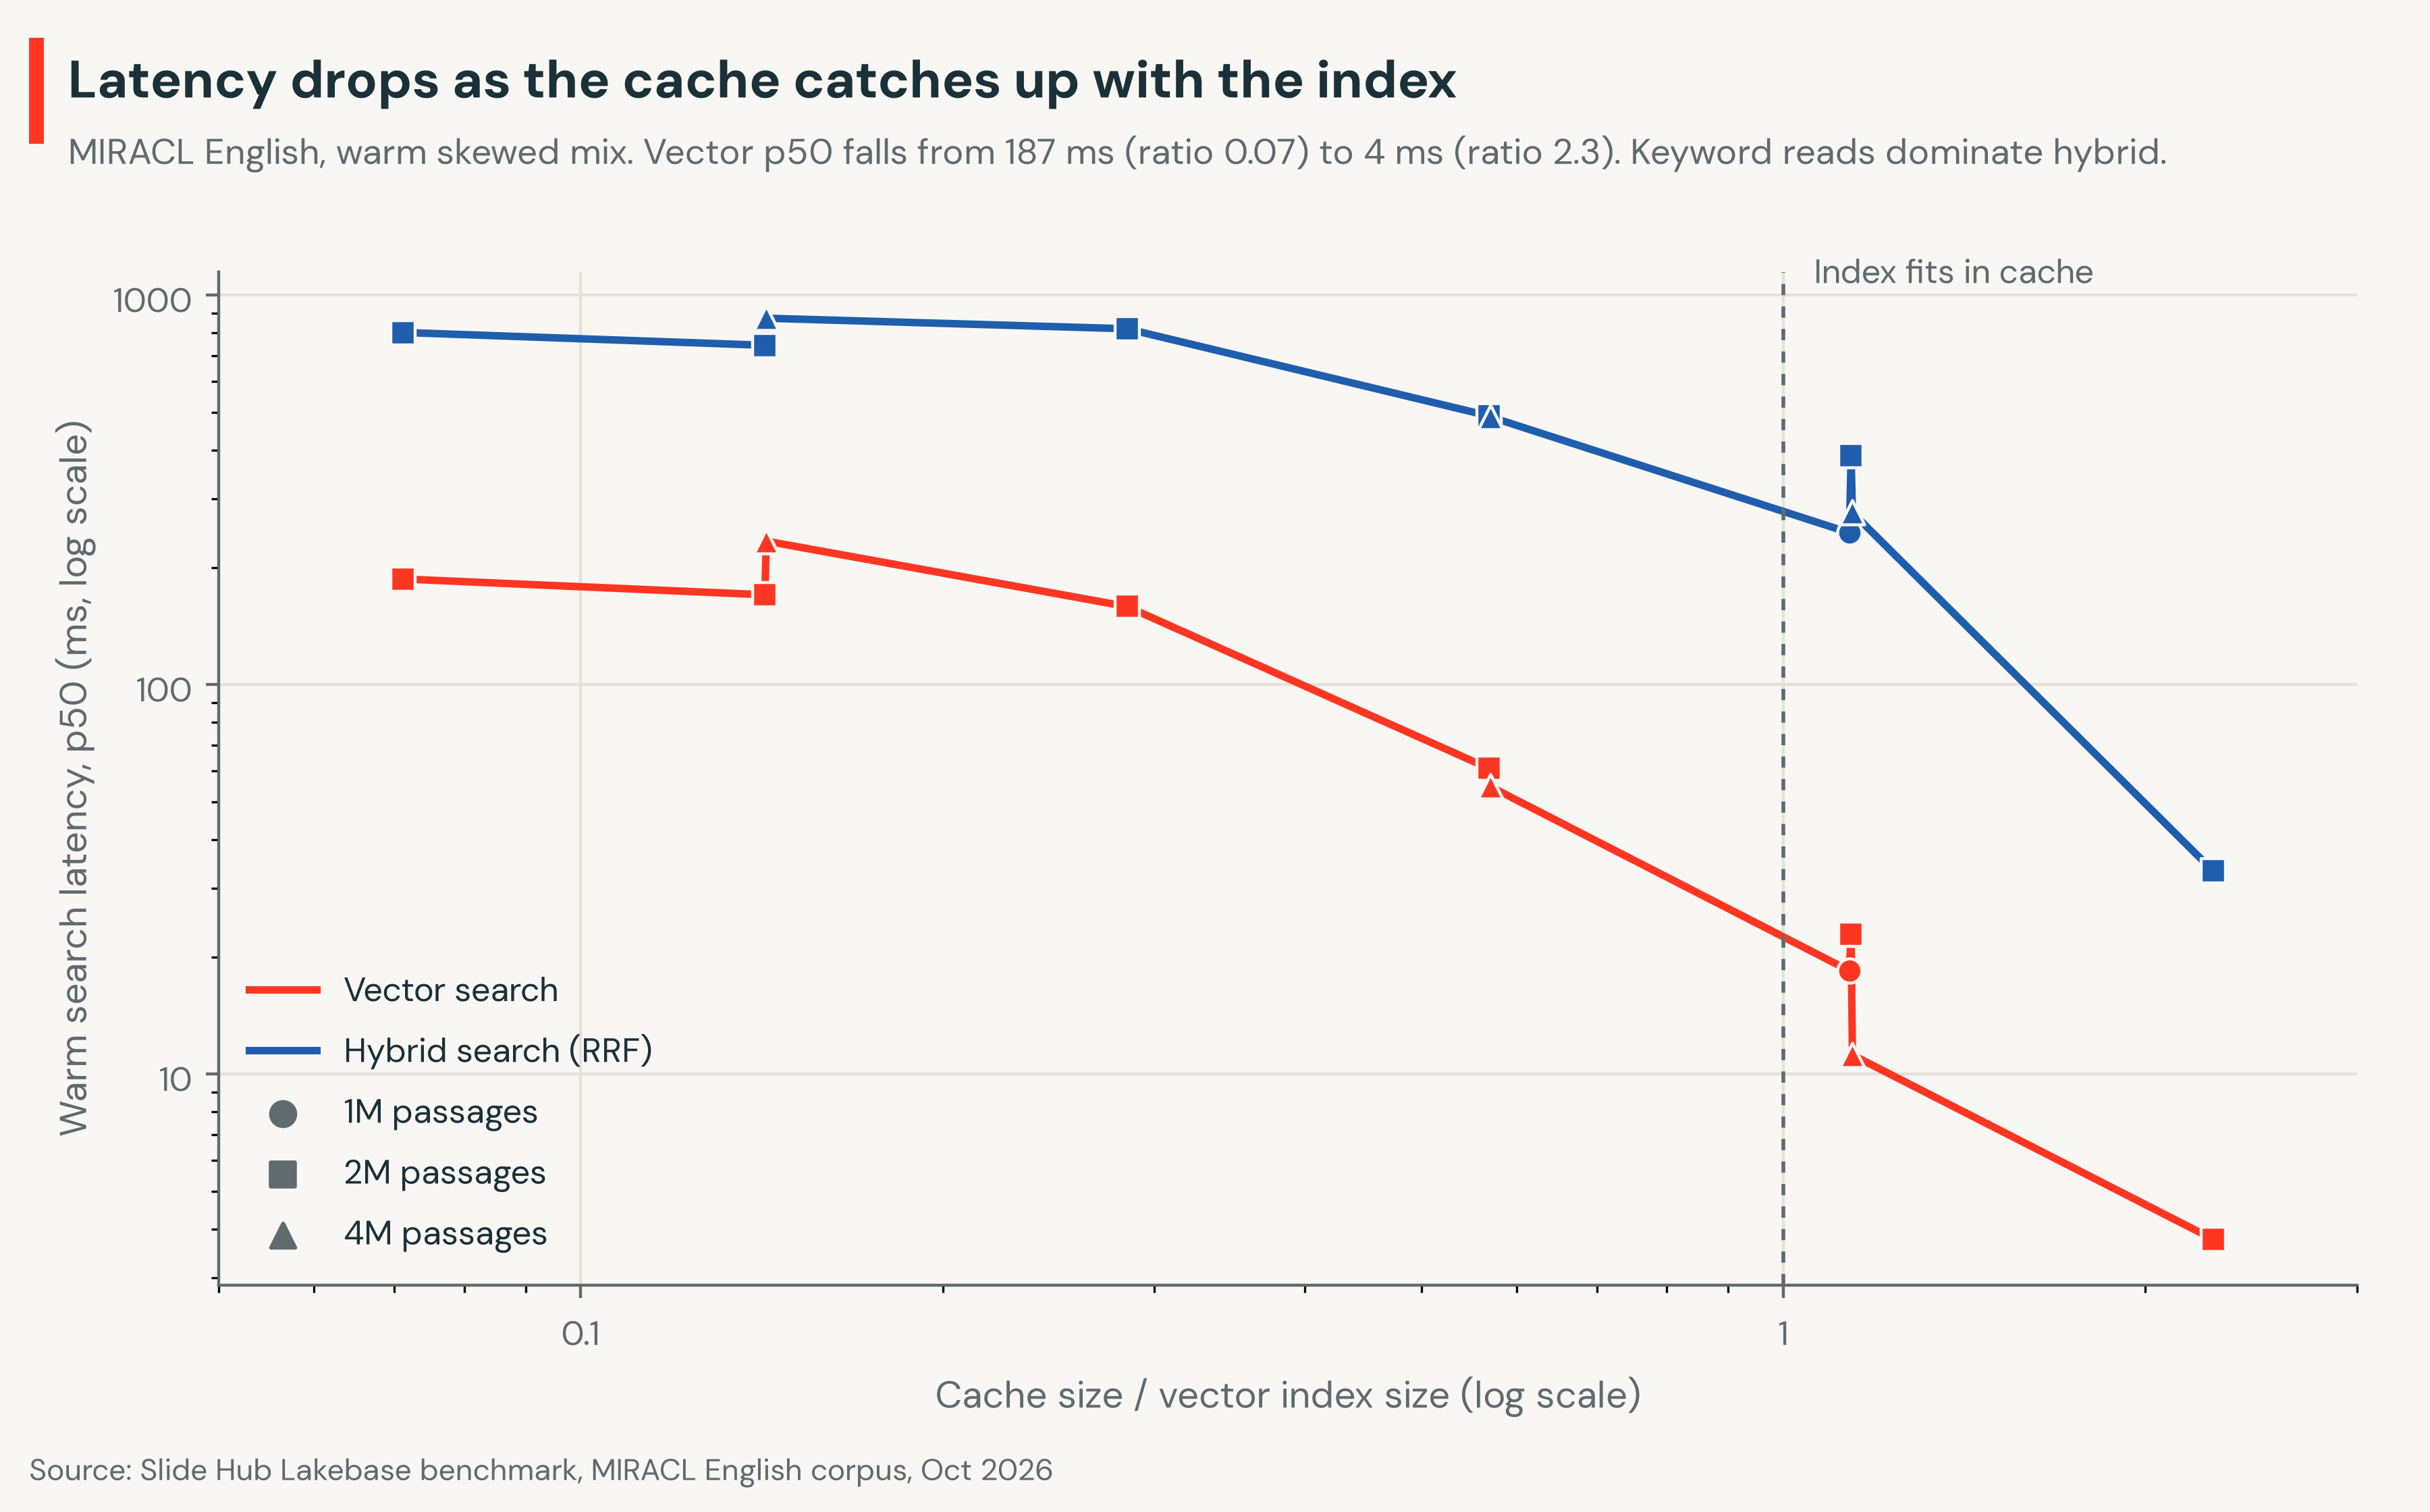
Warm latency over cache ratio, vector and hybrid.
Warm vector p50 fell from 187 ms at a ratio of 0.07 to 4 ms at a ratio of 2.3. Hybrid search stayed near 800 ms until the ratio approached 1, then dropped to 33 ms. The keyword half of the hybrid query reads the most pages, so it gains the most from a full cache.
Takeaway: Vector search takes 160 to 230 ms while the cache holds less than a third of the index, and 11 to 23 ms once the whole index fits.

Latency over storage misses. One miss costs about 0.3 ms.
A miss is one 8 KB Postgres page that is not in the Local File Cache. In the vector index, one page holds one or two embeddings. One page read from storage costs a fixed amount of time. Across every measured query, execution time grows by about 252 microseconds per missed page for vector search and 316 for hybrid. A query that misses 2,000 pages pays about half a second. A full cache removes almost all the misses. This is why the cache ratio sets the latency: it sets how many pages each query reads from storage.
Takeaway: Each page from storage adds about 0.3 ms. Multiply the storage misses per query by 0.3 ms to estimate what the cache saves you.
From cache, latency barely grows with the corpus

Latency over index size, from cache and from storage.
Hold the cache ratio near 1.0 and change the corpus size. Warm vector latency stayed between 11 and 23 ms from 1M to 4M. Warm hybrid latency stayed near 276 ms. The cold queries, which read from storage, grew with the corpus: a cold vector query went from 44 ms at 1M to 133 ms at 4M, and a cold hybrid query reached 911 ms at 4M.
This is the honest form of “you do not need the whole index in memory”: you do not, because the architecture keeps compute memory flat. RaBitQ stores about 1 bit per dimension, 32 times smaller than float32, and IVF reads only a few partitions per query. The index is storage-backed, so compute can be small or scale to zero. The queries that miss the cache pay for the miss, and the cache ratio controls how often that happens.
Takeaway: Grow the compute with the corpus, and warm latency stays flat. Only the queries that miss the cache get slower as the corpus grows.
Throughput scales with compute
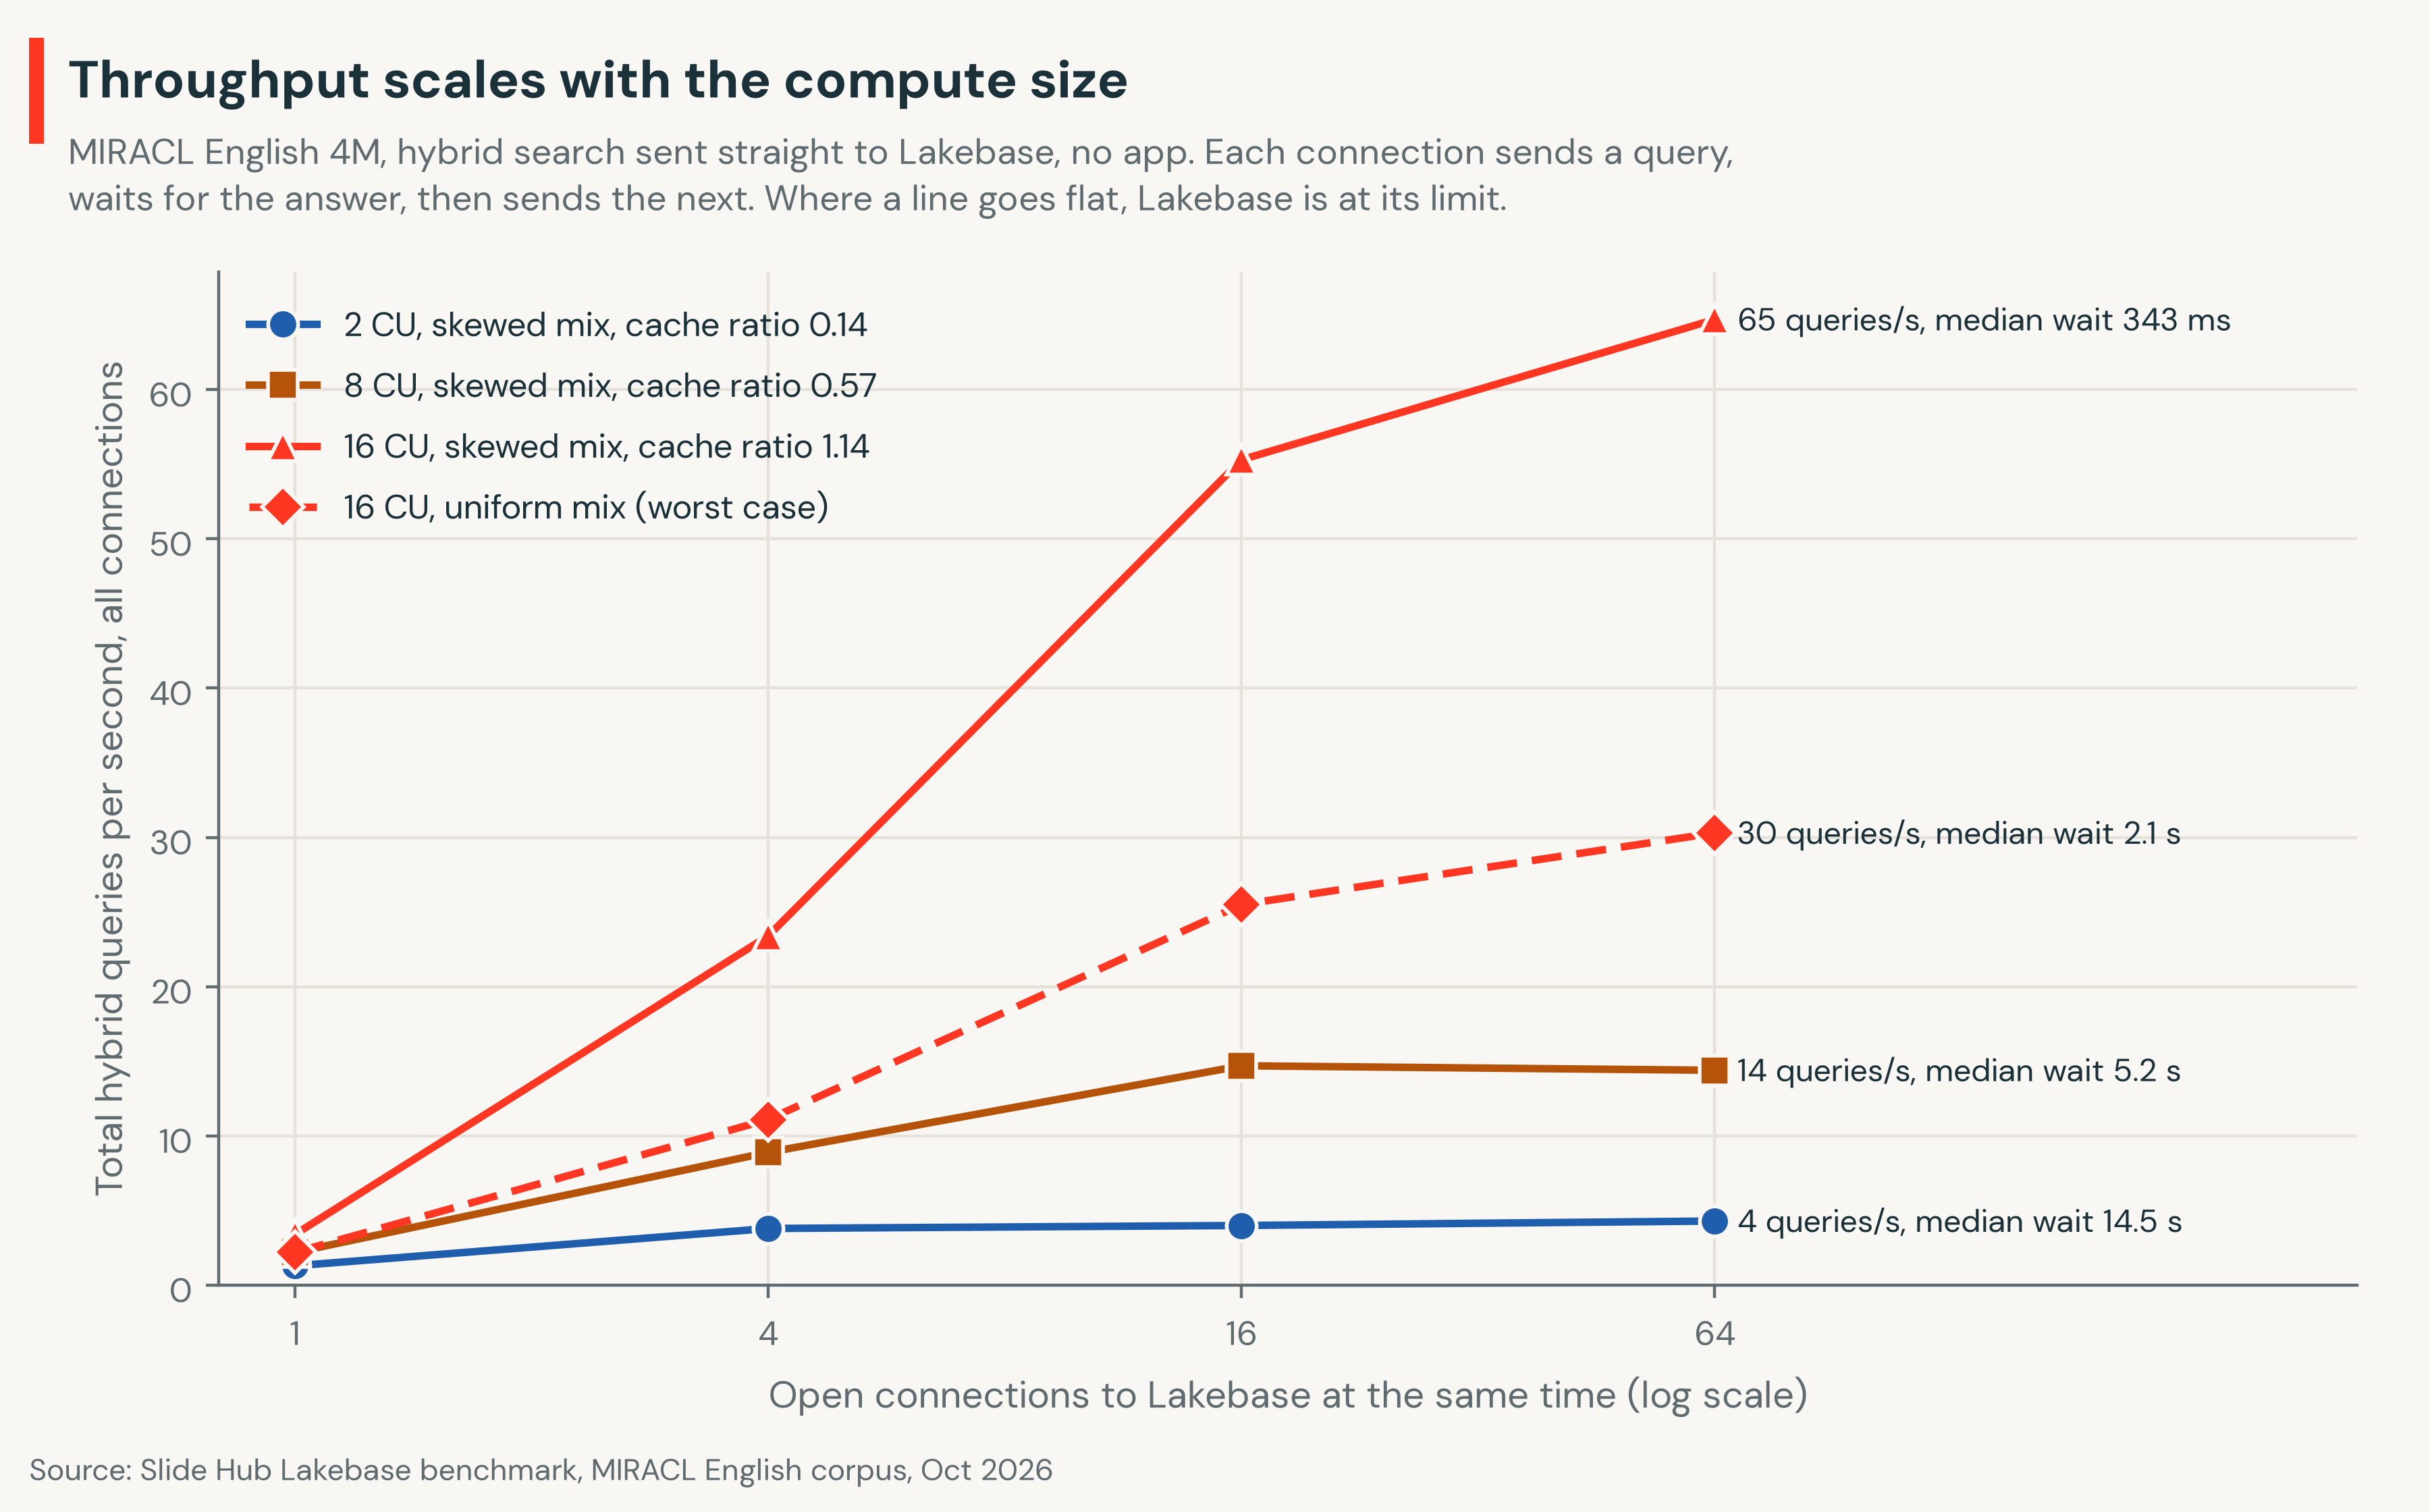
Total hybrid queries per second over the number of open connections, 4M passages.
The throughput test sent hybrid queries straight to Lakebase Postgres, without the app, so it measures the database alone. It opened 1, 4, 16, or 64 connections to Lakebase Postgres at the same time. Each connection sent a query, waited for the answer, and then sent the next one. The chart shows the total number of queries per second across all connections. When a line goes flat, more connections do not finish more queries. Lakebase Postgres is then at its limit, and each query waits longer instead. The load generator's own CPU stayed near zero, so Lakebase Postgres set every number.
On the 4M corpus the skewed mix reached about 4 queries per second at 2 CU, 15 at 8 CU, and 65 at 16 CU. At 64 connections, the median wait for one query was 14.5 s at 2 CU, 5.2 s at 8 CU, and 343 ms at 16 CU. The uniform mix at 16 CU peaked at 30 queries per second, because it never reuses a page. Throughput scales with the compute size and the cache ratio together.
Read these as the cost of cache misses under load. Most queries in a real app repeat or cluster, so the warm hit rate, not the uniform mix, sets steady-state capacity.
Takeaway: More CU buys throughput twice, with more CPU and a larger cache. Going from 8 CU to 16 CU raised the skewed throughput from 15 to 65 queries per second.
Recall against exact search
The lakebase_ann index is approximate. Recall@10 is the share of the true 10 nearest passages, from an exact search over all vectors, that the index also returns. The index splits the vectors into partitions (IVF), and lakebase_ann.probes sets how many partitions a query reads. Recall@10 barely moved with the corpus size at the default probe count: 0.74 at 1M, 0.75 at 2M, and 0.75 at 4M. More probes trade latency for recall.

Recall@10 over probes at 4M, for the default and the quality index build.
With the default index at 4M, the default 109 probes gave a recall@10 of 0.74 in 3 ms, and 2,000 probes gave 0.95 in 49 ms. An index built with build_mode = 'quality' raised recall at every probe count: 0.80 at the default probes in 3 ms, and 0.97 at 2,000 probes in about the same time as the default build. Its build took 52 minutes at 16 CU. Raising lakebase_ann.epsilon to 4, the highest value it accepted in our tests, added less than 0.3 points.[9] Recall depends on the data and the embedding model, so measure it on your own data and pick the probe count your app needs. Lakebase Search supports a single index of over 1 billion vectors.[1]
Takeaway: Build the vector index with build_mode = 'quality'. At the default probes it raised recall@10 from 0.74 to 0.80 in about 3 ms, and at 500 probes it reached 0.91 in 13 ms, which takes 1,000 probes and 20 ms on the default build. The cost is the build time: 52 minutes for 4M passages at 16 CU. Raise the probes only if your app needs more recall.
Cost
Lakebase cost follows use. A suspended compute incurs no compute cost, and storage is billed separately. Lakebase was about 1% of the Slide Hub 30-day bill. Slide Hub is an internal app, and a slower first search after 5 idle minutes is acceptable for its users, so its production database scales to zero when nobody searches.
The scale evaluation was cheap. The self-hosted embedding of the whole corpus took 2.95 GPU-hours, against $48.87 for the model-serving endpoint. One in-region load ramp ran for 14 minutes and cost $0.13 at list price: $0.11 for the app and $0.02 for Lakebase Postgres, which autoscaled between 0.5 and 1 CU and used 0.21 CU-hours. Up to 1,000 users the ramp served 109,602 requests without errors. The cells ran at 0.5 to 16 CU and suspended between runs. In our workspace's billing tables, one CU-hour is 0.213 DBU: about $0.085 at the Premium list price and $0.11 at the Enterprise list price in AWS US East.
Takeaway: Lakebase Postgres bills compute only while it runs. The 14-minute load test used $0.02 of Lakebase Postgres compute, and that compute cost was about 1% of the Slide Hub 30-day bill. For production, set the minimum to 0.5 CU instead of scaling to zero. At list price that costs about $31 to $40 a month, and searches no longer wait about 1 s for the compute to wake or start with an empty cache.[11] Let dev and test branches scale to zero.
A note on the data
MIRACL English is open. The corpus is Apache-2.0, and its passages come from Wikipedia under CC BY-SA. The embedding model gte-large-en-v1.5 is Apache-2.0.This post reports aggregate metrics only. The same test runs with any 1024-dimension model: swap the embedding step, keep the table, the indexes, and the search.
Conclusion
Think of Lakebase Postgres as a reader at a desk in front of a large bookshelf.
- The bookshelf is storage, and the desk is the cache. Pages on the desk are fast to read. Pages on the shelf take a walk, about 0.3 ms each.
- Make the desk as large as the books you use. When the cache is about as large as the vector index, almost every page is on the desk, and a vector search takes milliseconds.
- More CU gives a larger desk and more hands. That makes each search faster and lets Lakebase Postgres answer more searches at the same time.
- Ask for fewer books. A search that takes 200 candidates instead of 1,000 carries about a third of the pages and keeps 9 of the top 10 results.
- Sort the shelves well, then choose how many to search. An index built in quality mode returns 8 of the true 10 nearest passages at the default probes in 3 ms, and 97 of 100 with 2,000 probes in about 50 ms.
- The app has its own desk. Once Lakebase Postgres is fast, the app’s workers become the limit. Then give the app more workers. More Lakebase Postgres CU does not help at that point.
- You do not need the whole library on the desk. Lakebase Postgres reads the rest from storage. It is slower, but it works, and the cache ratio tells you how often it happens.
- You pay for the desk only while someone reads. When nobody searches, Lakebase Postgres can suspend and bill only storage; in Slide Hub it was about 1% of the 30-day bill. In production, keep a small desk open: 0.5 CU costs about $31 to $40 a month and avoids the cold start.
Databricks has three searches, and each one fits a different job. Pick the one that sits next to your data.
- Lakebase Search runs inside the app's Postgres database. Use it when the search must live next to the app's own tables and see each write at once.
- AI Search, formerly Vector Search, is a managed search service over Lakehouse tables in Unity Catalog. It keeps its index in sync with a Delta or Iceberg table and can create the embeddings for you. Use it for RAG, agents, and recommendations over Lakehouse data.
- Full-text search indexes (Beta) speed up SQL queries on managed Delta and Iceberg tables. The search and isearch functions use the index to skip files that cannot contain a match, so log and keyword lookups read less data. They filter rows and do not rank results for a search bar.
Slide Hub runs all of this in one Lakebase Postgres database: the app data, the vector index, and the keyword index. Start with the Lakebase Search docs, then run the same test against your own data.
 Instagram Engineering
 Shopify Engineering