A Category 4 hurricane makes landfall on Florida's Gulf Coast. Within hours — not weeks — insurers identify every affected property in the storm's path, match them against policy triggers, and begin issuing payouts. No adjusters dispatched. No claims forms filed. The data speaks for itself.
This is parametric insurance in action. Unlike traditional indemnity models, which reimburse verified losses through lengthy claims assessments, parametric policies pay out automatically when predefined conditions are met — wind speeds crossing a threshold, rainfall exceeding a set level, or an earthquake reaching a specific magnitude. Payouts are tied to objective event data from trusted third-party sources like NOAA and USGS, which means faster funds, clearer terms, and far less administrative overhead.
The shift is made possible by advances in catastrophe modeling. Modern cat models fuse geospatial data, weather observations, engineering insights, and historical loss records to estimate the probability and impact of extreme events — hurricanes, floods, wildfires, earthquakes. These models power a growing range of use cases: flood risk scoring, climate scenario analysis, elevation modeling, rooftop analytics, and land parcel assessment. For parametric programs specifically, they provide the foundation for defining triggers that are both reliable and fair.
But modeling alone isn't enough. Operationalizing parametric insurance means processing massive volumes of geospatial and environmental data in near real time. Satellite imagery, weather feeds, exposure datasets, and cat model outputs all need to converge so that when a triggering event occurs, the right policies pay the right amounts immediately. This is where the Databricks Geospatial Lakehouse comes in — unifying these data sources on a single platform so insurers can scale catastrophe analytics from insight to payout.
Business Insights by Persona
The Databricks Lakehouse delivers catastrophe insights to every function across the insurance value chain. Each team starts from the same unified data but asks different questions:
| Persona | Key Question |
| Underwriter | Which properties fall within the hurricane impact zone, what’s our total exposure, and how should we price this region going forward? |
Risk Manager | How concentrated is our exposure in high-risk regions, and are we within risk tolerance thresholds? |
Claims | Which policies should trigger immediate payout, and can we validate damage quickly? |
Finance | What is the estimated loss vs reinsurance coverage, and what’s the hit to portfolio profitability? |
Underwriter
Geospatial portfolio filtering lets underwriters view policies within a storm footprint, overlaid with hurricane tracks, wind zones, or flood extents. Exposure heatmaps surface high-value clusters at a glance, and property-level drill-downs show insured value, coverage limits, and location risk. Genie enables natural-language exploration of the same data.
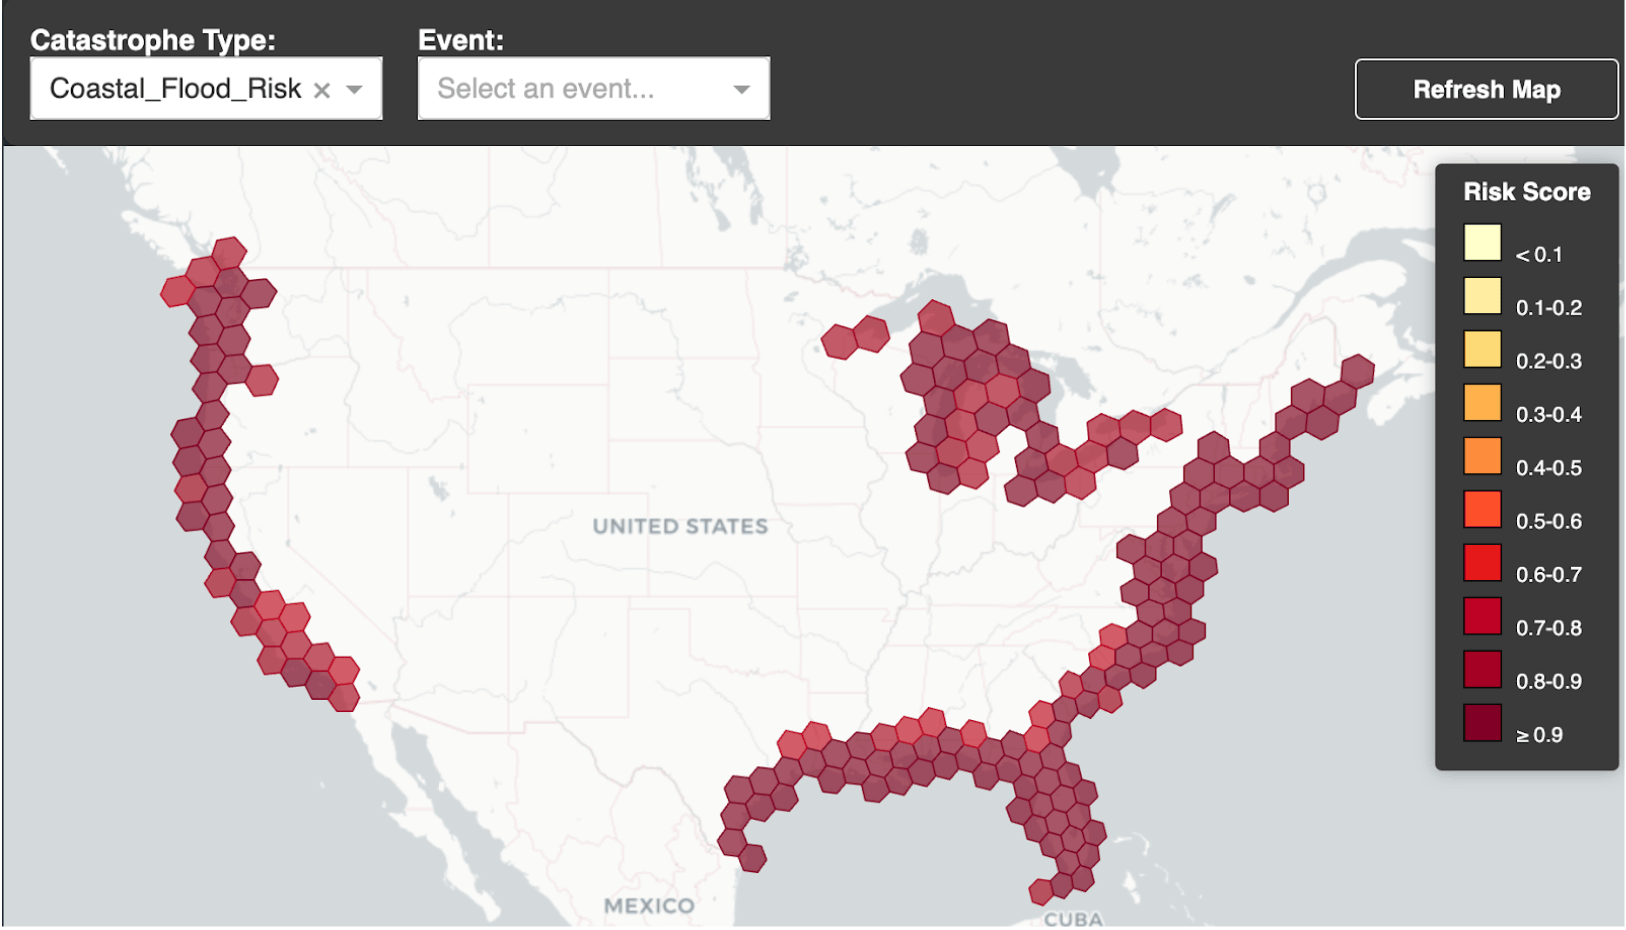
Risk Manager
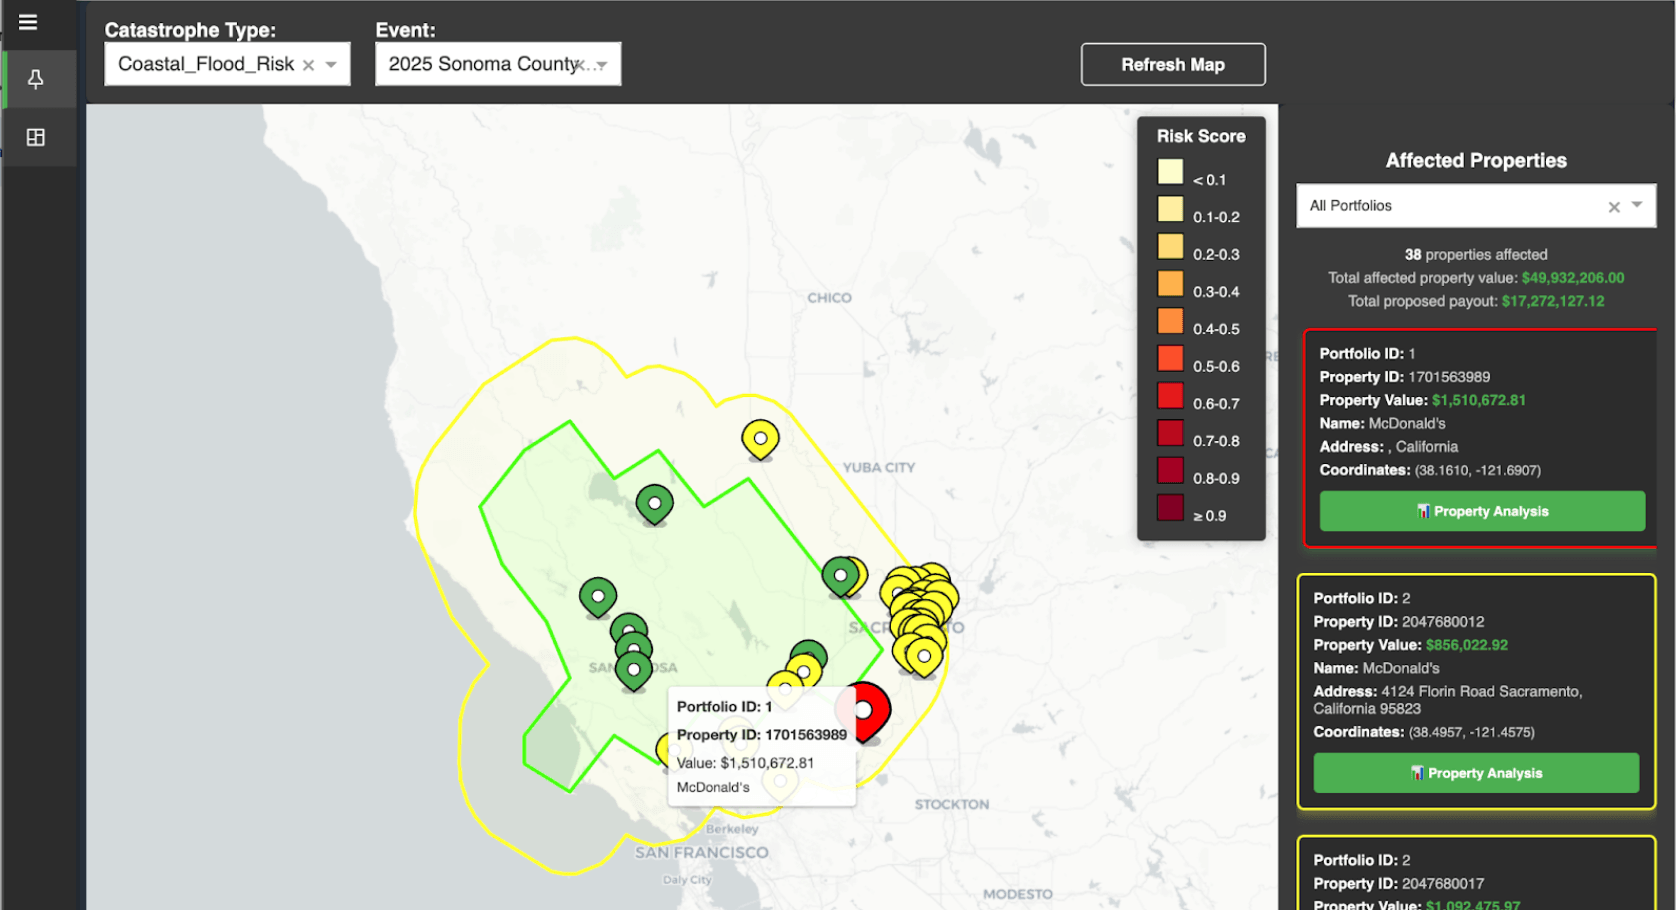
Risk managers monitor geographic concentration and catastrophe accumulation across the portfolio. Filtering by catastrophe type or specific event renders affected properties on a map — color-coded by severity — with portfolio details accessible per property.
Claims Investigator
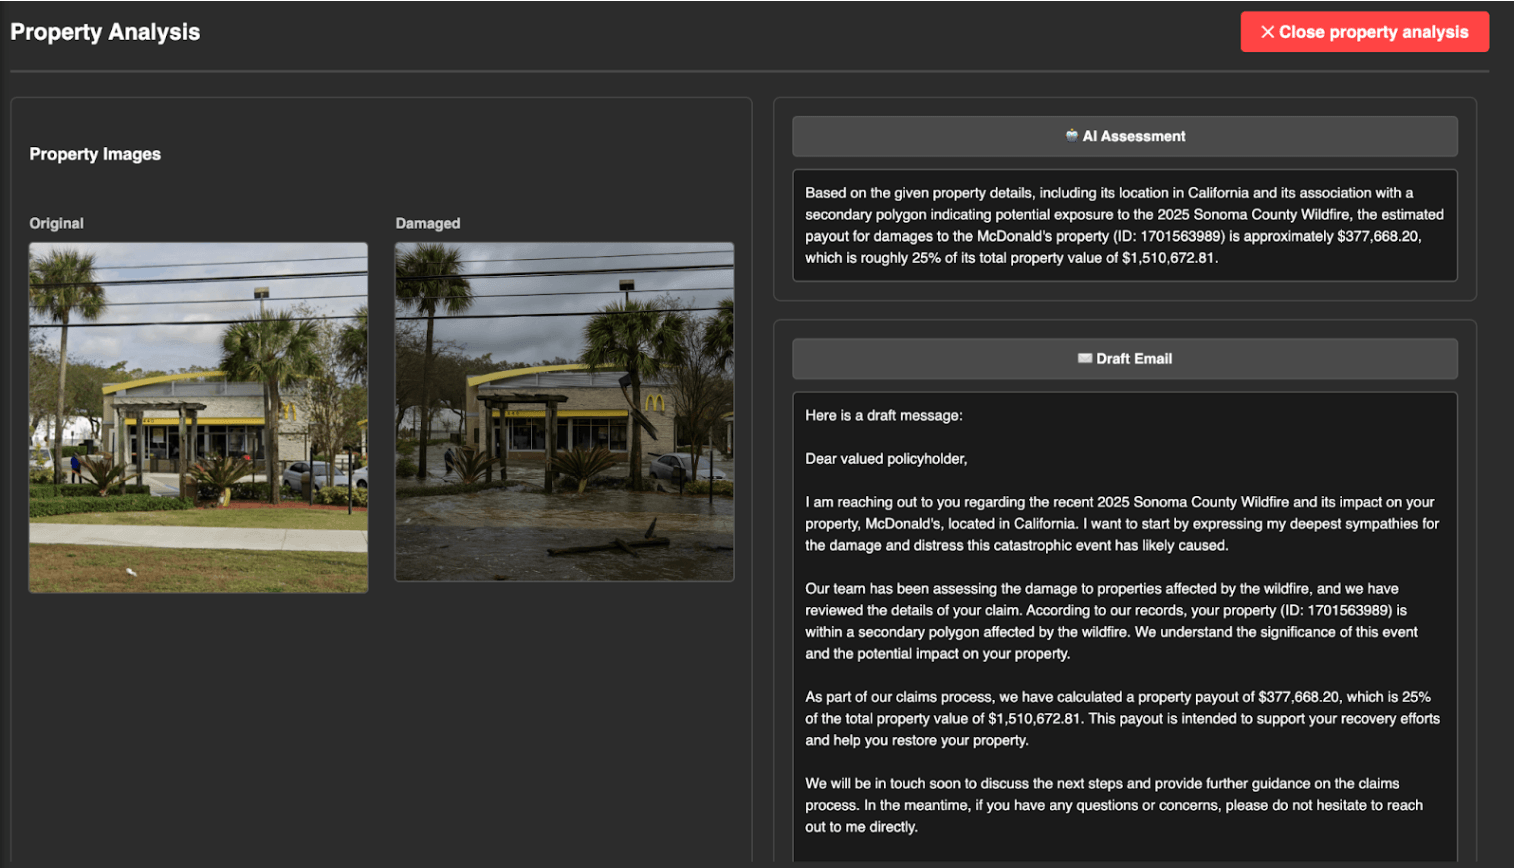
Parametric triggers are detected automatically when event thresholds are crossed, surfacing eligible policies and geospatial payout zones. For validation, clicking into any property brings up before-and-after aerial imagery. Multimodal AI models on Databricks can analyze this imagery to confirm damage patterns, flag potential fraud, and accelerate payouts — all governed through the AI Gateway.
Finance
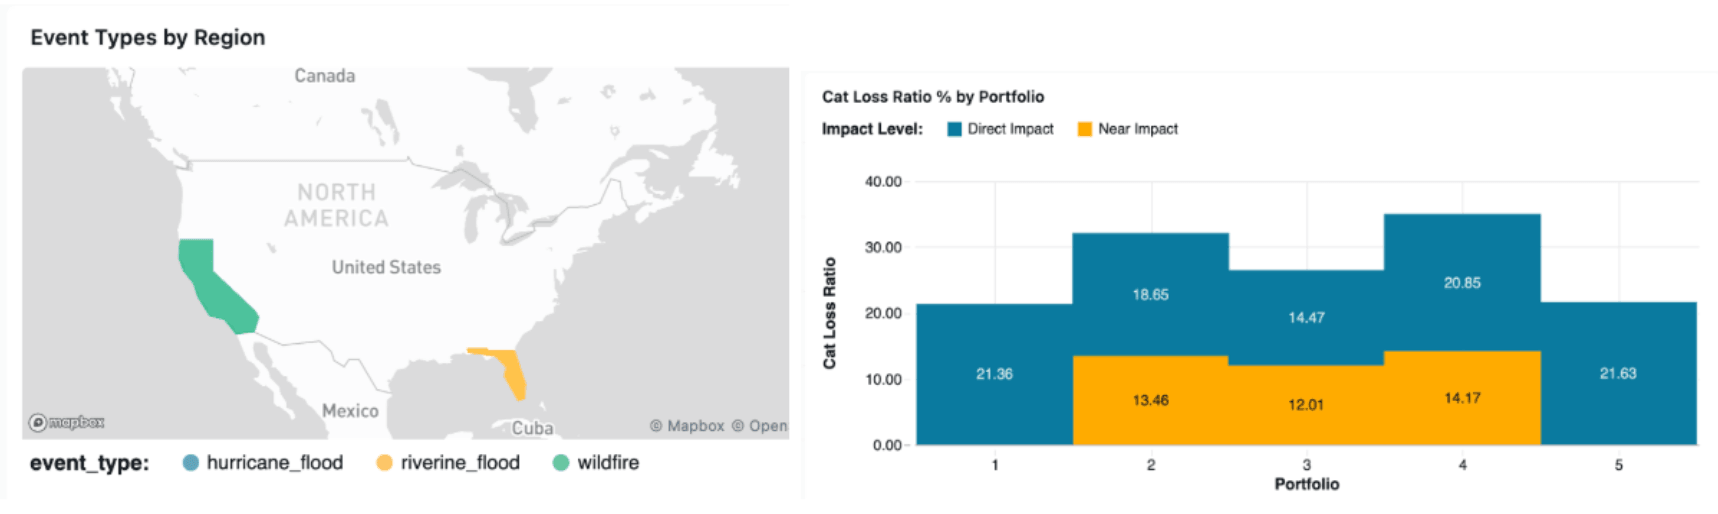
Event loss estimation dashboards give finance teams a real-time view of capital exposure and portfolio performance as catastrophe events unfold.
Lakehouse Architecture for Parametric Insurance
The Lakehouse architecture unifies hard-to-attain geospatial data sets for analytics and ML. Databricks’ Geospatial Lakehouse helps insurers, reinsurers, and risk modelers manage, analyze, and act on location-based data at scale, a crucial enabler for parametric insurance, catastrophe modeling, and risk engineering.
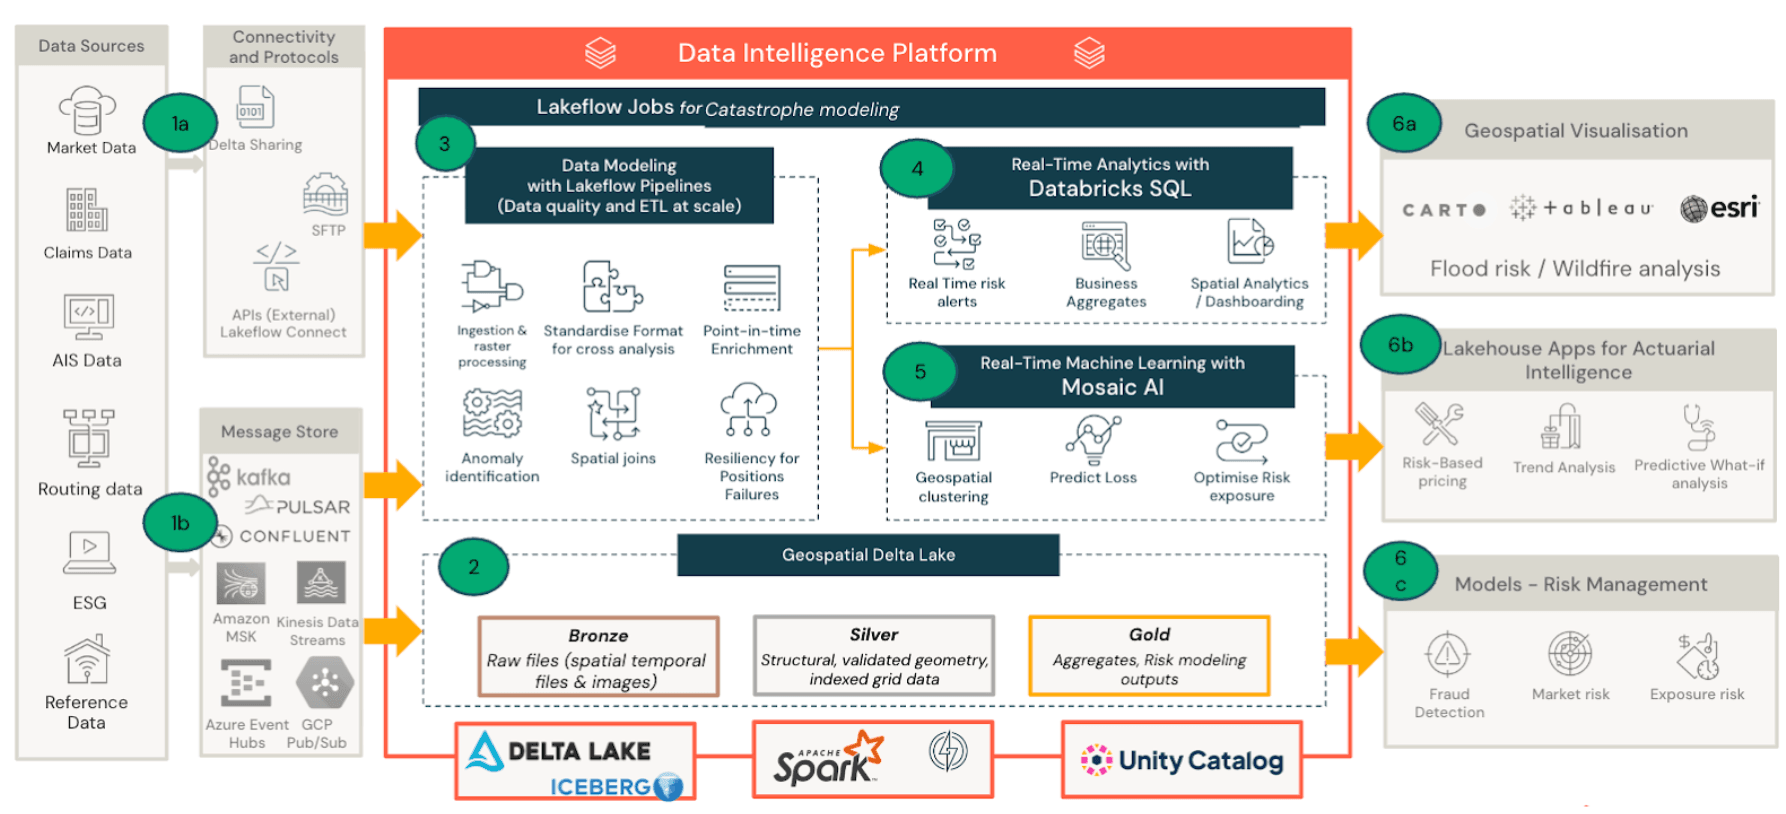
- Data ingestion: Satellite data, hazard feeds, and exposure datasets land in Delta Lake.
- Geospatial processing and modeling: Spatial joins, proximity analysis, and catastrophe modeling pipelines run on Spark.
- Business consumption: Dashboards, Lakehouse Apps, and Genie enable analysts and executives to explore catastrophe exposure and trigger payouts.
Here is a summary of the key benefits:
Data lands in the Lake
When a hurricane forms, satellite imagery, NOAA wind observations, flood model outputs, and seismic feeds begin streaming into Delta Lake alongside the insurer's own exposure and policy data. Delta Live Tables and Structured Streaming keep these layers continuously updated, so by the time the storm makes landfall, the platform already has a near-real-time picture of conditions on the ground. Typical data sources include:
Hazard Event Data (Trigger Sources) | - Satellite & Remote Sensing Data – e.g., rainfall, temperature, wildfire spread (NASA, ESA, NOAA).
- Seismic Data – earthquake magnitude, depth, epicenter (USGS, IRIS).
- Wind & Cyclone Tracks – maximum sustained wind speeds, storm paths (IBTrACS, NOAA HURDAT2).
- Flood Modeling Outputs – river gauge data, inundation depth (Copernicus Emergency Management, GFMS).
- Drought Indices – NDVI, soil moisture anomalies, rainfall deficits (FEWS NET, CHIRPS, SMAP).
|
Exposure & Asset Data | - Insured Asset Locations – lat/lon coordinates of covered properties, farms, infrastructure.
- Portfolio Metadata – value at risk, asset class/type, coverage limits, policyholder ID.
- Population or Crop Distribution – gridded census data, agricultural yield maps (WorldPop, FAO, GEOGLAM)
|
Validation and Market Data | - Historical Payout Logs – past parametric payouts and ground-truth event data.
- Event Footprint Archives – modeled impact areas for cyclones, floods, etc.
- Claims Correlation Studies – traditional vs. parametric claims for model calibration.
- Climate Risk Projections – IPCC scenarios, downscaled CMIP6 data.
|
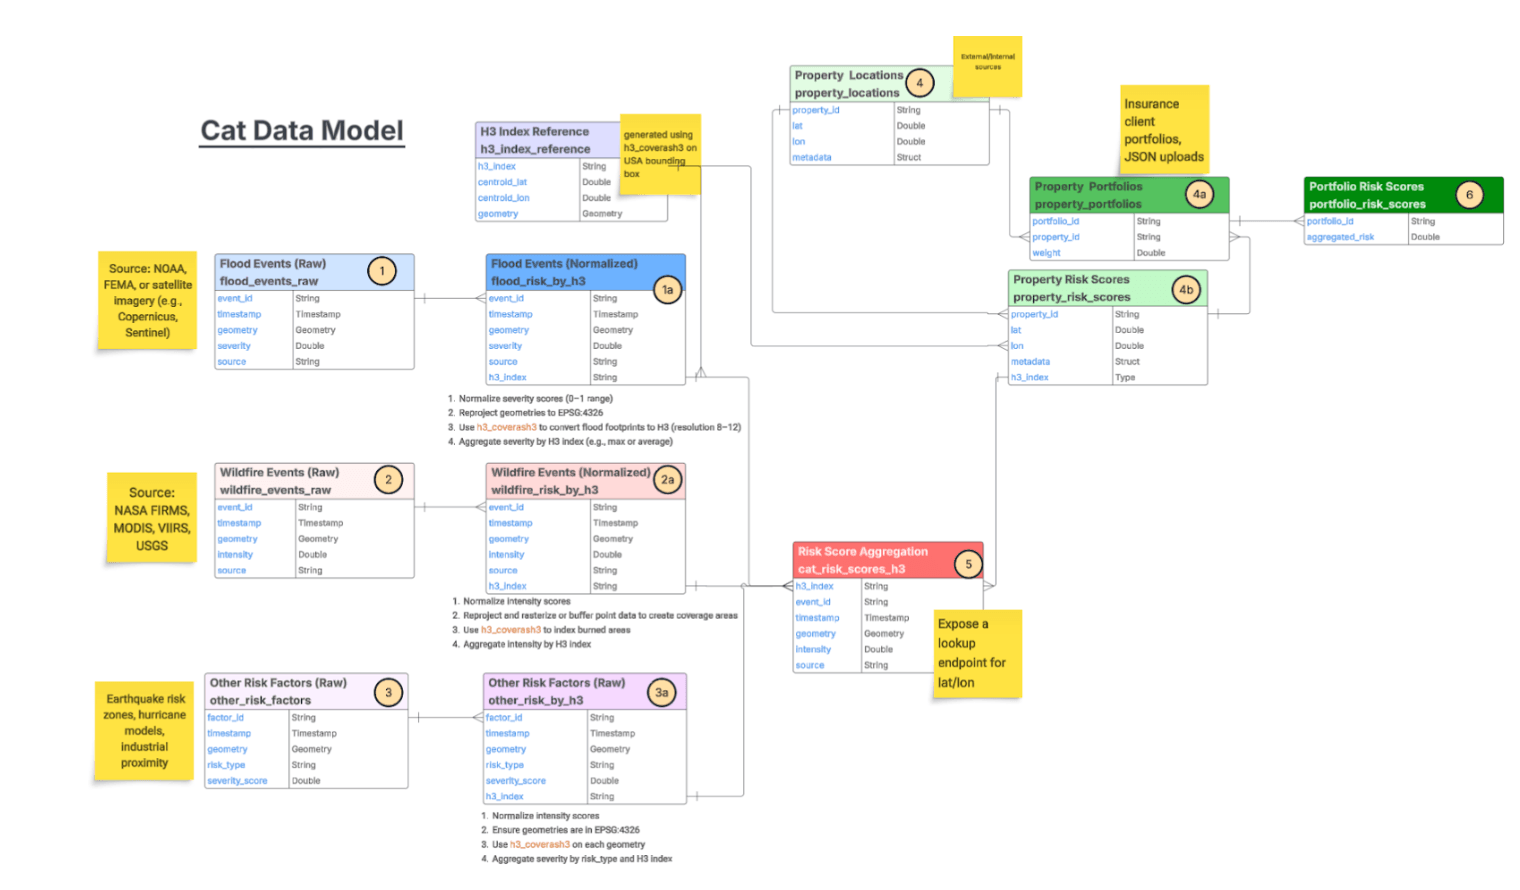
Geospatial processing matches events to policies
As hazard data flows in, the medallion architecture normalizes it into H3 indices and risk scores. Spark SQL's 100+ native spatial functions such as ST_Intersects, ST_Within, ST_Buffer, ST_Distance enable distributed spatial joins to match every insured asset against storm footprints, flood zones, and concentric payout tiers. Operations that would choke a traditional GIS tool scale to billions of geotagged rows.
Triggers fire and payouts go out
When event measurements cross policy thresholds, the platform identifies eligible policies, calculates tiered payouts based on proximity to the epicenter, and surfaces results to claims teams through dashboards, Lakehouse Apps, and Genie. AI models validate damage against aerial imagery before payouts are released.
Governance holds it together
Unity Catalog provides fine-grained access control, lineage tracking, and metadata management across every spatial dataset in the pipeline. When brokers, reinsurers, or regulators need access, Delta Sharing delivers it without duplicating data.
Key Takeaways
- Parametric insurance is transforming catastrophe response, enabling faster payouts triggered by objective event data.
- Geospatial analytics and catastrophe modeling are critical for defining accurate triggers and reducing basis risk.
- The Databricks Geospatial Lakehouse unifies satellite data, exposure data, and catastrophe models, enabling insurers to analyze risk at global scale.
- AI and machine learning further enhance parametric programs, supporting damage validation, fraud detection, and improved risk modeling.
As climate-driven catastrophes increase in frequency and severity, insurers must move toward faster, more data-driven approaches to risk transfer. By combining large-scale geospatial analytics with unified data and AI capabilities, the Databricks Lakehouse enables insurers to transform catastrophe insights into rapid, transparent payouts.